If your like me, you may have gotten a little over enthusiastic about calculation groups and dropped a number of them into a report page only to find that while dense with information, the report page or visual can be a bit sluggish to load. In my first post here, I want to share a technique for optimising calculation group performance. The performance gains will obviously vary depending on your calculation groups content and purpose but in this example where I have three very common calculation groups in a matrix, I was able to gain a three fold performance increase. I was also able to roughly halve the execution time of a single time intelligence calculation group.
First a little background:
On a recent project we were given a requirement to create a table visual with dynamic text, dynamic segmentation and conditionally formatted column headers. We knew we would probably need calculation groups due to the dynamic elements, segmentation and mix of different data types. In the final solution we opted for an approach shown in the following diagram where instead of trying to create calculation groups for both columns and rows, we instead created a single calculation group and a disconnected table with a column of index values to reference. We then created calculation items that returned different results depending on the SELECTEDVALUE() of the index.
In the final visual, the actual row and column headers are hidden so that the dynamic results from the calculation items can be used as row and column headers.

Sample Logic Column Header Calc Item =
SWITCH (
SELECTEDVALUE ( ‘Column Header Disconnected Table'[Index] ),
1, [Dynamic text logic],
2, “Static text”,
3, “Static text”,
4, “Static text”,
SELECTEDMEASURE ()
)
The benefits of this approach was that all the logic for the visual was stored in one calculation group and writing the DAX was arguably simpler because rather than trying to make two calculation groups interact or even just two different filters interact between columns and rows, instead we could just write a single calculation item for each row of the matrix that returned all the values we needed depending on which index value was present in the filter context.
The approach got me thinking that having a single calculation item instead of two might result in better performance. I was also really impressed by the recently shipped optimisation to the SWITCH function that greatly improved the performance of SWITCH and so I decided to investigate whether these concepts could be leveraged for better performance in calculation groups.
The Optimisation Technique:
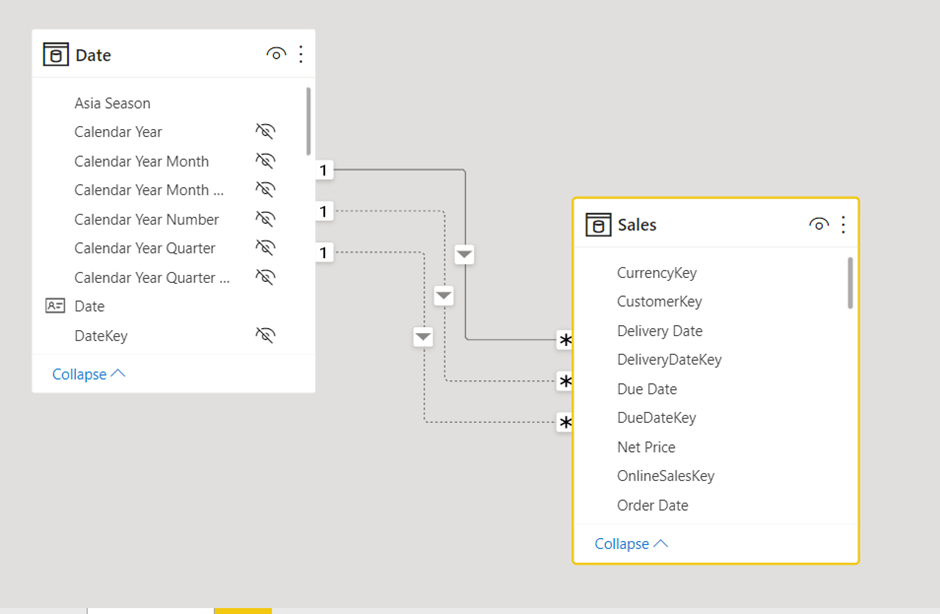
I am using the standard Contoso model from The definitive guide to DAX companion content to demonstrate this technique with some additional date relationships included for delivery date and due date. I also removed a few columns from the Sales table to make it a smaller file. There is a link to the PBIX at the end of this post. Here is the source model from SQLBI:
The Definitive Guide to DAX – 2nd Edition – SQLBI
To test the performance improvement, I created three common calculation groups, one that has a basic measure ( Sales Amount, Quantity, Margin and Margin %) in each calculation item, some Time Intelligence and a Relationship calculation group that activates order date, delivery date or due date. I added these three calculation groups to a matrix and filtered the page to March 2009 in the filter pane. For the Time Intelligence calculation group I have used standard time intelligence patterns from DAX patterns but avoiding sideways recursion, the measures referenced in the “Metric” calculation group reference base measures in the model and the relationships calculation group wraps SELECTEDMEASURE() with CALCULATE and USERELATIONSHIP.


The optimisation technique uses a disconnected table and switch statement in a calculation item so for the optimised version of the matrix, I replicated the three calculation groups in the following way applied for the time intelligence calculation group.
I created a disconnected table with a column containing the names of the time intelligence values required and a sort column. Here is the time Intelligence calculated table.

I then created a calculation group with a single “Time Intelligence” calculation item that uses the column of time intelligence names to return an associated time intelligence calculation using a SWITCH statement and saving separate time intelligence calculations as variables. I have colapsed some of the code here to make it more readable.

The benefit of this approach is simplified maintenance from having all your logic in one single DAX expression but more importantly because it’s a single expression, we can optimise by leveraging variables for any logic that can be reused between the individual calculations. In the regular time intelligence calculation items, each calculation items needs to contain all the logic required for the calculation and we can’t save variables to use across different calculation items. Its quite useful to be able to evaluate some DAX once and reuse it across multiple different calculations and this technique is a way that allows you to do this with variables.
Seasoned Power BI users may find this technique familiar and know that it’s the same principle we used to use for switching measures before calculation groups, but instead of putting the switch statement in a measure we can put it in a calculation group and get the benefits of dynamic format strings. Speaking of format strings, they are also easier to maintain and kept to a single format string expression. Here is my format string expression for the time intelligence. Note that you can again use logic to avoid having to specify every format string individually.

In my example I have set the format string in the “Metrics” calculation group so aside from specifying where a percentage should be returned, I can allow the other format strings to pass unaffected.
In my “Metric” calculation group, I can also reuse some logic to try and squeeze some more performance:

Here is my identical matrix created using the optimised calculation groups. These can be used in the same way as the standard calculation groups, in slicers, visuals or the filter pane although you need to use the disconnected table values for selections and apply the calculation item as a filter on any visual you want the logic applied to.

The original matrix with standard calculation groups has the following server timings for the query with a benchmark run with 5 cold cache executions, about 5.1 seconds:
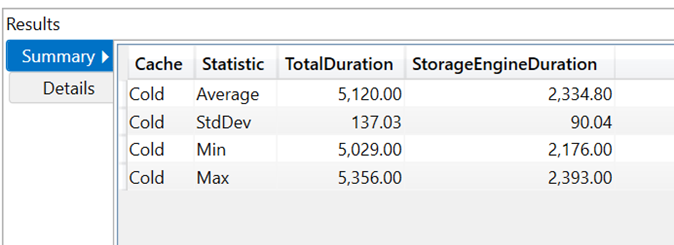
Here is a formula and storage engine split:

The query resulting from the same matrix with the optimised calculation groups had the following benchmark results, around a 1.3 second average:

Here are a formula and storage engine split. The Formula Engine percentage is higher but it is still significantly faster.

I ran the benchmarks again later with my laptop plugged in to a power source and got much faster times, 1.8 seconds average for standard vs 0.5 seconds average for optimised. About 3.6 times faster. The optimised version also appears to have a simplified query with less steps.
It’s worth noting that there is also a good performance boost without using variables to optimise the calculations, that’s just a bonus. I setup 3 x matrix visuals with the standard time intelligence calculation group, a version using the disconnected table but with no reuse of variables and the fully optimised version with disconnected table and variables across the calculations. I stacked years, quarters, month’s and brand on the rows. Here are the server timings from each query:


As you can see, if you want to squeeze some extra performance out of your calculation groups and consolidate your code into fewer expressions, this can be a good option. Particularly if you have logic that can be stored in variables for reuse across your calculations.
There are some downsides to using this technique though. Firstly its not a good experience and could be confusing for report creators and users of the model. You need to first add a column from a disconnected table to your visual then apply a calculation item as a filter on the visual, page or report. You could argue though that calculation groups are not intuitive for users anyway but nevertheless, this should probably remain hidden from any users. Also, whilst there are benefits to having all the DAX in one expression, it can be harder to navigate once it becomes long. I still think having the benfits of calculation groups with snappier performance is worth it though!
There is a further element beyond the recent optimisation of the SWITCH function and the improved code efficiency from variables that may help this technique improve performance. Internally calculation groups also execute a kind of switch statement. There is some built in optimisation called constant folding, a kind of “branch pruning” where the branches of the conditional logic that need to be evaluated are reduced by determining the branch to be calculated before the code is executed. I dont fully understand it but that is gist of it I got when I was privelleged enough to have a chat with Krystian Sakowski who was largely behind the implementation of calculation groups in Power BI. Unfortunately the prescence of the ordinal number in calculation groups prevents this optimisation from happening. You can remove the ordinal column through the XMLA endpoint if you have Premium licensing but not with Pro licensing. Because our optimised calculation groups only have a single calculation item, my thinking is the ordinal would no longer be a factor. Its kind of pushing the switch logic into the optimised DAX function and not relying on the calculation groups switch logic.
Thanks so much for taking the time to read this long post! Let me know what you think 🙂
PBIX Link:
https://1drv.ms/u/s!AsHSIacDcAWKqWd64S6EKilInB-Y?e=IE0Slg
Note: 29/12/21 – As Jorge Esteves kindly pointed out in the comments, the Time Intelligence Optimised SWITCH statement can be optimised a bit further by reusing the ValueCurrentPeriod variable. In my code I created this three times unnecessarily! 😊

Leave a reply to Kane Snyder Cancel reply